
hitter csv
pitcher csv
Blast motion csv
OVERVIEW (CTZ Graph & Contact Quality in %)
game stats section
general stats
| GP | GS | GF | CG | QS | IP | TBF | H | R | ERA | K | BB |
ADVANCED STATS
CONTROL THE ZONE
| K% | BB% | Strike% | FPS% | 1-1Str% | 2KStr% | 2KPos.Out% | Whiff% | FBS% | CBS% | CHS% | SLS% |
Limit damage
| BABIPa | HC% | GB% | FB% | LD% | XBH% | WHIP | FIP |
- CHpct
- CBpct
- FBpct
- CH%
- CB%
- FB%
RAPSODO SECTION
pitch characteristics
year to date average
| Pitch Type | Pitch_Count | Velo_Avg | Velo_Max | Spin_Avg | Spin_Max | True_Spin_Avg | True_Spin_max | Spin_Eff_Avg | Spin_Eff_Peak |
| bauerUnit | VertB_Avg | VertB_Max | HorzBreak_Avg | HorzBreak_Max | Gyro_Degree | Release_Height_Avg | Release_Side_Avg | Release_Angle_Avg |
Individual sessions
| date | Pitch Type | Pitch_Count | Velo_Avg | Velo_Max | Spin_Avg | Spin_Max | True_Spin_Avg | True_Spin_max | Spin_Eff_Avg | Spin_Eff_Peak |
| date | bauerUnit | VertB_Avg | VertB_Max | HorzBreak_Avg | HorzBreak_Max | Gyro_Degree | Release_Height_Avg | Release_Side_Avg | Release_Angle_Avg |
- ChangeUp
- CurveBall
- Fastball
- Slider
- TwoSeamFastball
Strike Zone Display
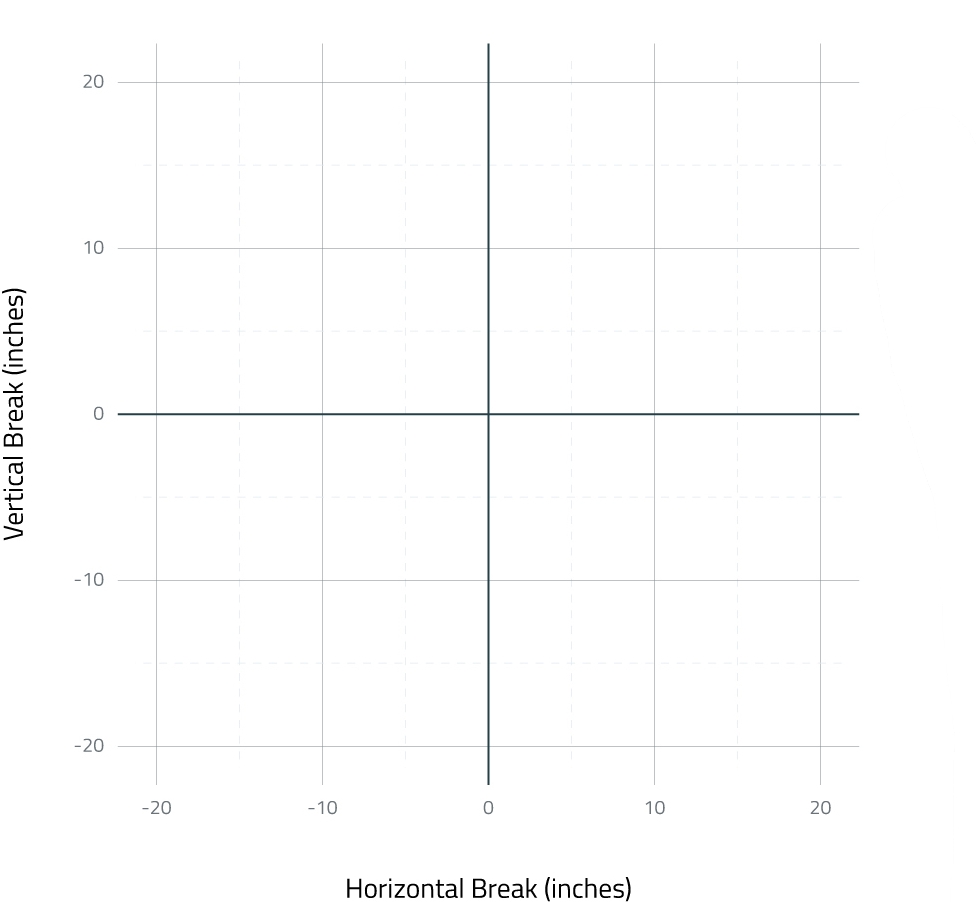
horizontal vs vertical break
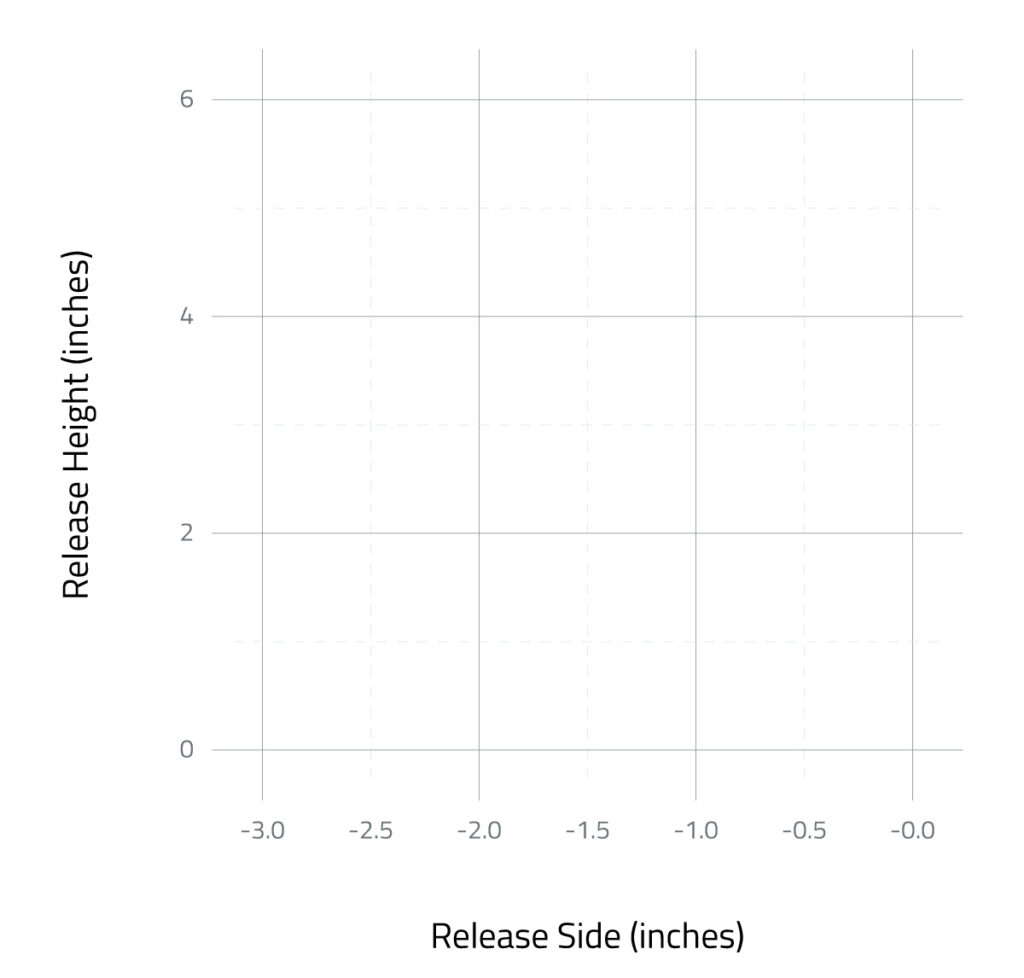
Release Point Characteristics

overview
GAME STATS SECTION
General Stats
| GP | PA | AB | R | H | RBI | K | BB | SB | CS | AVG | OBP |
DEFENSE STATS
game position player
advanced stats
control the zone
| K% | BB% | Whiff% | Chase% | QAB1% | QAB2% | QAB3% |
hitting
| OPS | wOBA | RC | XBH | KS | KL |
| CT% | H/RISP | BA/RISP | HC% | GB% | LD% | FB% | Pop% | Tot. BIP |
blast motion-game
year to date performance
| Contacts | BatSpeed_Avg | BatSpeed_Peak | OnPlane_Avg | Onplane_Peak | Rot_Acc_Avg | Rot_Acc_Peak | AA_Avg | TTC_Avg | TTC_Max | TTC_Min | VertBatAngle_Avg |
individual sessions
| Test Date | Contacts | BatSpeed_Avg | BatSpeed_Peak | OnPlane_Avg | Onplane_Peak | Rot_Acc_Avg | Rot_Acc_Peak | AA_Avg | TTC_Avg | TTC_Max | TTC_Min | VertBatAngle_Avg |
year to date average
| Contact | Exit Velo | Launch Angle | Avg Spin Rate | Whiff% | Chase% |
per game date
| Test Date | # Contact | Exit Velo | Launch Angle | Avg Spin Rate | Whiff% | Chase% |
blast motion
average
| Attack Angle(deg) | Ball Flight Swings | Bat Speed(mph) | Connection Score | Connectionat Impact(deg) | Early Connection(deg) | Estimated Distance(feet) | Exit Velocity(mph) | Launch Angle(deg) | On Plane Efficiency(%) |
| Peak Hand Speed(mph) | Plane Score | Power(kW) | Rotation Score | Rotational Acceleration(g) | Time to Contact(sec) | Total Swings | Vertical Bat Angle(deg) |
Individual Sessions (Test Date + Practice Date)
| Test Date | Contacts | BatSpeed_Avg | BatSpeed_Peak | OnPlane_Avg | Onplane_Peak | Rot_Acc_Avg | Rot_Acc_Peak | AA_Avg | TTC_Avg | TTC_Max | TTC_Min | VertBatAngle_Avg |
rapsodo
spray chart
- dribbler
- ground-ball
- low-line-drive
- high-line-drive
- fly-ball
- pop-up
year to year average
| Contact | Exit Velo | Launch Angle | Avg Spin Rate | Whiff% | Chase% |
Individual Sessions (Test Date + Practice Date)
| Test Date | # Contact | Exit Velo | Launch Angle | Avg Spin Rate | Whiff% | Chase% |
DEFENSE
CATCHERS
| Pop Time | Transfer | Radar |
[/um_show_content]
Errors
Field%
Throwing
Fielding